Containers
Understanding and Cost Optimizing Amazon EKS Control Plane Logs
Amazon Elastic Kubernetes Service (Amazon EKS) is a managed container service that provides a highly available single-tenant control plane to run and scale Kubernetes applications in the cloud or on-premises. Logs are an important way to debug problems, audit cluster activities, and monitor the health of your application.
Kubernetes logging can be divided into control plane logging, worker node logging, and application logging. The Kubernetes control plane is a set of components that manage Kubernetes clusters. With Amazon EKS, you can turn on logging for specific control plane components that track different types of information and send them as log streams to a group in Amazon CloudWatch. You can easily enable or disable each log type on a per-cluster basis during or after cluster creation.
While there are benefits to enabling all control plane log types, you should be aware of the information in each log and the associated costs. You are charged for the standard CloudWatch Logs data ingestion and storage costs for logs sent to Amazon CloudWatch Logs from your clusters. Configuring the right retention and archival for these logs is important to ensure that you’re getting the most value from them, while not overspending to ingest and store them.
This post provides an overview of each type of Amazon EKS control plane log type, and discusses the value provided by them. In addition, the post explores ways to obtain insights from these logs while optimizing on cost.
Control plane logging architecture
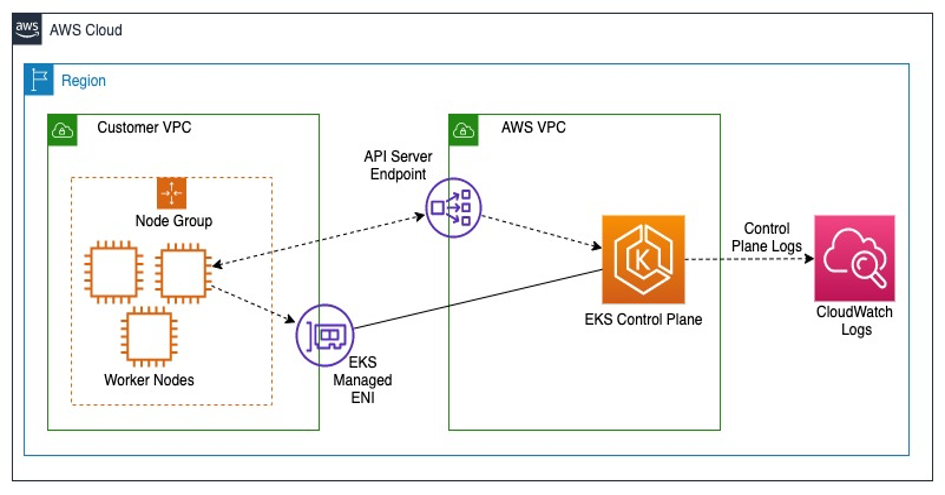
Figure 1. Architectural diagram showing collection of Amazon EKS control plane logs
Figure 1 above shows how the Amazon EKS control plane sends the logs to Amazon CloudWatch. The shipping of these logs is handled in the control plane, which is managed by AWS. Worker node components and processes do not have a way to intercept or filter the contents of the logs sent from the control plane to Amazon CloudWatch. As an Amazon EKS cluster administrator, you get the choice to decide which control plane log types you want to enable.
Control plane log types
The control plane components make global decisions about the cluster. They detect and respond to cluster events. You can check if the control plane logging is enabled on by selecting an Amazon EKS cluster in the Amazon EKS console and navigating to the Logging tab, as shown in the following figure.
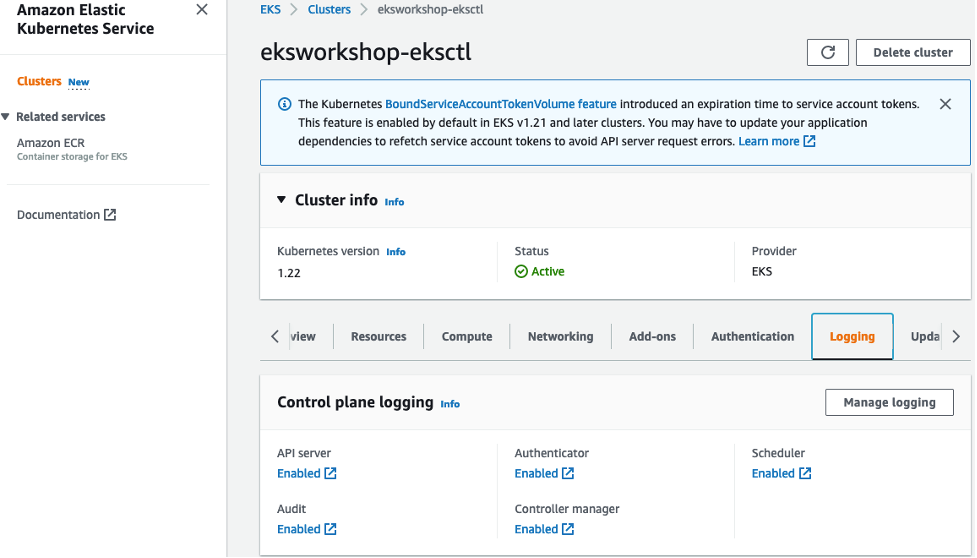
Figure 2. Amazon EKS console with the Logging tab selected
From the Manage logging section, you can easily enable or disable each control plane log type.

Figure 3. Manage Logging page in the Amazon EKS console to edit control plane logging settings
To view the control plane logs, open the Amazon CloudWatch console, go to the Log groups under the Logs tab and filter with the /aws/eks prefix. Under the Log group for your Amazon EKS cluster, you can find the log streams for each component. As the log stream data grows, the log stream names are rotated. When multiple log streams exist for a particular log type, you can view the latest log stream by looking for the log stream name with the latest Last Event Time.
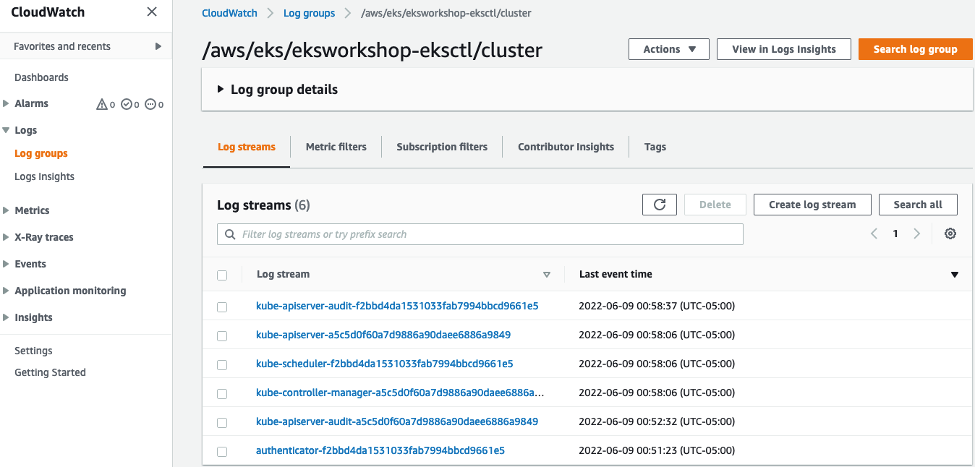
Figure 4. Log streams within a Amazon CloudWatch Log group
Let’s now understand the information provided by each control plane log type.
Kubernetes application programming interface (API) server component logs – This represents the logs from the Kubernetes API server (kube-apiserver). The API server provides a frontend to the cluster’s shared state through which all other components interact. The API server validates and configures data for the API objects exposed by Kubernetes and persists the state of the cluster to the etcd backing store. The Kubernetes API supports retrieving, creating, updating, deleting resources, and additional sub-resources that allow fine grained authorization. In the API server component logs, you can find information about the flags that the API server started with. It also contains information about the different admission controllers loaded and the actions of API server components, such as the cacher. You can view the API reference for more details about the Kubernetes API.
Audit logs – The cluster audits the chronological API activities generated by users, application, and other control plane components. It answers what, where, when did it happen and by whom for activities that occurred in your cluster. It contains information for the different stages of the API server’s processing of the request. For more information, see Auditing in the Kubernetes documentation. This log type usually has the highest volume of log events, as every activity in your cluster is recorded here. This sample audit log shows a Kubernetes user rbac-user attempted to list a resource type pods in the namespace kube-system which resulted in a 403 forbidden error.
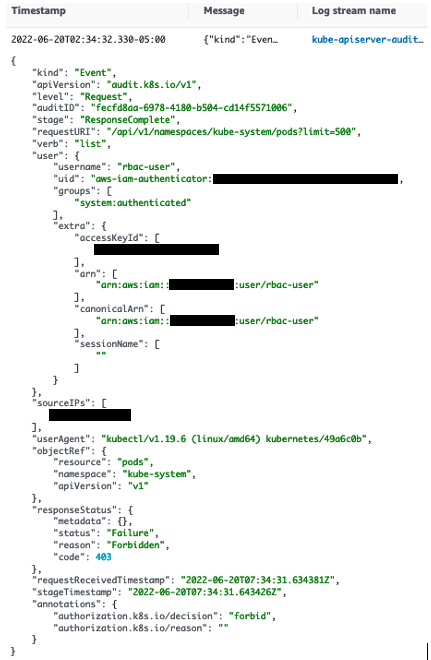
Figure 5. Example of an audit log displaying a 403 forbidden error
Authenticator logs – This is an Amazon EKS specific log type that records authentication requests to the cluster using AWS Secure Token Service (AWS STS) with AWS Identity and Access Management (IAM) roles, in combination with the Kubernetes role-based access control (RBAC). You see logs for authentication requests and access granted for the different users and roles who use your Amazon EKS cluster. This sample Authenticator log shows a Kubernetes user, rbac-user is mapped to a corresponding IAM user with the same name.
![]()
Figure 6. Sample Authenticator log showing the mapping between a username and IAM role
Controller manager logs – Kubernetes manages the cluster state through a series of control loops implemented using specific controller processes. The controllers watch for deviation between the observed state and the desired state. When necessary, the controllers that are managed by the controller manager, take necessary actions on the cluster to bring the state of the cluster to the desired state. This log type records the actions taken by the controllers on your cluster. As an example, we generated some load on the Kubernetes deployment named proddetail, associated with a Horizontal Pod Autoscaler (HPA). The HPA automatically scales the number of replicas to match demand. From the controller manager log, you can check the HPA controller periodically adjusts the desired scale to match observed metrics.

Figure 7. Controller manager logs showing HPA scaling events
Scheduler logs – Scheduler determines how to place the pods on the available worker nodes based on the constraints and available resources. The scheduler then ranks each valid Node and binds the Pod to a suitable Node. In these logs, you can find information for how any nodes were evaluated, determined as feasible and the node to which the pod was bound eventually.

Figure 8. Scheduler logs with node selection activities for pod placement
As you can see, all the above logs provide useful information in understanding your cluster’s operations and troubleshooting any issues. However, these logs maybe not always be actively monitored. This can lead to you paying for ingestion and storage of these logs, but without deriving much value from them.
Cost optimization options
We recommend selectively enabling log types for non-production environments, especially when you can recreate workload behavior, as needed. This way, you can turn on the specific log types only when log analysis is needed, and turn off the log types after the analysis is complete. This option is likely not suitable for a production cluster where you either do not have the luxury of replicating certain behaviors. You may not know why a certain issue occurred, without looking at the logs for that duration. In this situation, we recommend enabling all log types and focusing more on the retention and archival strategies.
Change your Amazon CloudWatch log retention option
Once you enable the Amazon EKS control plane logs, your logs are stored and accessible in Amazon CloudWatch. Amazon CloudWatch logs never expire with the default retention policy. Unless you explicitly change the retention policy, Amazon CloudWatch logs remain in your account, incurring storage costs applicable to your AWS region. For these reasons, we recommend you to enable logs when required, and change the retention policy for each log group based on your workloads’ log retention requirements.
Exporting your Amazon CloudWatch log to Amazon Simple Storage Service (Amazon S3) for archival
Amazon CloudWatch delete your Amazon EKS control plane logs after the retention period has passed. While this is convenient, some workloads may need to archive these logs to meet compliance or regulatory requirements. For storing Amazon CloudWatch logs long term, we recommend exporting your Amazon EKS CloudWatch logs to Amazon Simple Storage Service (Amazon S3). This can be done by creating an export task for a one-time export. In order to export your logs regularly, we recommend scheduling AWS Lambda functions using Amazon EventBridge to automate this process. You can export the logs on a cadence that you select, before the logs expire after reaching its retention period.
After you have done so, Amazon S3 presents many options to further reduce cost. You can define your own Amazon S3 Lifecycle rules to move your logs to a storage class that a fits your needs, or leverage the Amazon S3 Intelligent-Tiering storage class to have AWS automatically move data to long-term storage based on your usage pattern.
Analyzing Amazon EKS control plane logs in Amazon S3
Exporting your Amazon EKS control plane logs to Amazon S3 is a great option for optimizing on costs. One downside is that once the logs leave Amazon CloudWatch, you lose access to natively supported features in Amazon CloudWatch, including Amazon CloudWatch Logs Insights, which is a purpose-built tool that enables you to interactively search and analyze your log data in Amazon CloudWatch. However, once your logs are in Amazon S3, you can now leverage Amazon Athena. Amazon Athena is a serverless interactive query service designed for querying data in Amazon S3. You can use your familiar standard SQL to query the logs for your use case.
Enabling Amazon GuardDuty and Amazon Detective for automated threat detection and in-depth analysis
If your main reason for enabling Amazon EKS control plane logs is to identify anomalous behavior and threats from malicious actors, you can consider using Amazon GuardDuty for your Amazon EKS cluster protection. Amazon GuardDuty for Amazon EKS does not require you to turn on or store Amazon EKS control plane logs. Amazon GuardDuty can look at the Amazon EKS cluster audit logs through direct integration. It looks at the audit log activity and report on the new Amazon GuardDuty finding types that are specific to Kubernetes resources. Some examples of these findings are provided in the following:
- Credential or secret access from known malicious IP addresses
- API operations successfully invoked by
system:anonymoususer - API invoked from a Tor exit node IP address
These findings aim to identify malicious actors, Tor nodes, privilege escalation, and security misconfigurations. As a result, you can defer to Amazon GuardDuty for any intrusion detection focused analysis of your control plane logs and avoid building custom log analysis focused on this.
In addition to Amazon GuardDuty, Amazon Detective creates visualizations of Amazon GuardDuty findings and provides access to the entity profiles to correlate security events. An entity can be Amazon EKS clusters, container pods, AWS accounts, IAM user, IAM roles, federated user, Amazon EC2 instance or IP address. It can help you more quickly answer questions such as: which Kubernetes API methods were called by a Kubernetes user account showing signs of compromise, which pods are hosted in an Amazon EC2 instance that was included in Amazon GuardDuty findings, or which containers were spawned from a potentially malicious container image.
Conclusion
This post described the different Amazon EKS control plane logs types and ways to optimize costs based on your requirements. It provided you with options to save on Amazon CloudWatch logs costs, including disabling log types that may not be required, archiving logs for long-term retention, and leveraging Amazon GuardDuty and Amazon Detective for threat detection. Understanding the levers available for consuming Amazon EKS control plane logs not only help you in optimizing costs, but also allows you to focus on the most relevant logs for root causes analysis and attribution.