 The blackbox-exporter is an exporter that can monitor various endpoints – URLs on the Internet, your LoadBalancers in AWS, or Services in a Kubernetes cluster, such as MySQL or PostgreSQL databases.
Blackbox Exporter can give you HTTP response time statistics, response codes, information on SSL certificates, etc.
What are we going to do in this post:
- with the help of Helm, will deploy the kube-prometheus-stack in Minikube
- deploy the Blackbox Exporter itself
- configure monitoring of endpoints with the Kubernetes ServiceMonitors, which will be created through the blackbox-exporter config
- will take a brief overview of Blacbkox’
probeswhich are used to poll endpoints
Let’s go.
Contents
Running the Kube Prometheus Stack
We will do this setup in the Minikube, where we will install Prometheus Operator from the Helm repository.
Launch the Minicube itself:
[simterm]
$ minikube start
[/simterm]
Add the Prometheus chart repository:
[simterm]
$ helm repo add prometheus-community https://prometheus-community.github.io/helm-charts
$ helm repo update
[/simterm]
Create a namespace:
[simterm]
$ kubectl create ns monitoring
[/simterm]
Install the kube-prometheus-stack chart:
[simterm]
$ helm -n monitoring install prometheus prometheus-community/kube-prometheus-stack
[/simterm]
Wait a few minutes until all pods become Running:
[simterm]
$ kubectl -n monitoring get pod
NAME                                                     READY   STATUS            RESTARTS      AGE
alertmanager-prometheus-kube-prometheus-alertmanager-0   1/2     Running           1 (25s ago)   44s
prometheus-grafana-599dbccb79-zlklx                      2/3     Running           0             57s
prometheus-kube-prometheus-operator-689dd6679c-s66vp     1/1     Running           0             57s
prometheus-kube-state-metrics-6cfd96f4c8-84j26           1/1     Running           0             57s
prometheus-prometheus-kube-prometheus-prometheus-0       0/2     PodInitializing   0             44s
prometheus-prometheus-node-exporter-2h542                1/1     Running           0             57s
[/simterm]
Find the Prometheus Service:
[simterm]
$ kubectl -n monitoring get svc
NAME                                      TYPE        CLUSTER-IP       EXTERNAL-IP   PORT(S)                      AGE
alertmanager-operated                     ClusterIP   None             <none>        9093/TCP,9094/TCP,9094/UDP   7s
prometheus-grafana                        ClusterIP   10.97.79.182     <none>        80/TCP                       20s
prometheus-kube-prometheus-alertmanager   ClusterIP   10.106.147.39    <none>        9093/TCP                     20s
prometheus-kube-prometheus-operator       ClusterIP   10.98.222.45     <none>        443/TCP                      20s
prometheus-kube-prometheus-prometheus     ClusterIP   10.107.26.113    <none>        9090/TCP                     20s
...
[/simterm]
Open access to the Service by using the port-forward:
[simterm]
$ kubectl -n monitoring port-forward svc/prometheus-kube-prometheus-prometheus 9090:9090
[/simterm]
Open http://localhost:9090, and check if everything is working:
Running blackbox-exporter
Its chart present in the same repository, so just install the exporter:
[simterm]
$ helm -n monitoring upgrade --install prometheus-blackbox prometheus-community/prometheus-blackbox-exporter
[/simterm]
Check the Pod:
[simterm]
$ kk -n monitoring get pod
NAME                                                              READY   STATUS    RESTARTS        AGE
prometheus-blackbox-prometheus-blackbox-exporter-6865d9b44h546j   1/1     Running   0               27s
...
[/simterm]
Blackbox keeps its config in a ConfigMap, which connects to the Pod and passes default parameters. See more here>>>.
[simterm]
$ kk -n monitoring get cm prometheus-blackbox-prometheus-blackbox-exporter -o yaml
apiVersion: v1
data:
  blackbox.yaml: |
    modules:
      http_2xx:
        http:
          follow_redirects: true
          preferred_ip_protocol: ip4
          valid_http_versions:
          - HTTP/1.1
          - HTTP/2.0
        prober: http
        timeout: 5s
[/simterm]
Actually, here we can see the modules, just one so far, which use the http prober to make HTTP requests to the targets, which still needs to be added.
Blackbox and ServiceMonitor
In order to add endpoints that we want to monitor, we can use ServiceMonitor, see config here>>>.
For some reason, this moment is not really described anywhere in the googled guides, although it is very useful and simple: we add a list of targets to the Blackbox config, and the Blackbox creates a ServiceMonitor for each of them, and Prometheus starts monitoring them.
Create a file blackbox-exporter-values.yaml with only one endpoint for now – just to check if it’s working at all:
serviceMonitor:
  enabled: true
  defaults:
    labels:
      release: prometheus
  targets:
    - name: google.com
      url: https://google.com
If not specified otherwise, Blackbox uses the default values from the values.yaml of the chart, in this case, it will be the http_2xx module that executes GET request and checks the response code: if the 200 is received, then the check is passed, if another, then it’s failed.
Update the Helm release with the new config:
[simterm]
$ helm -n monitoring upgrade --install prometheus-blackbox prometheus-community/prometheus-blackbox-exporter -f blackbox-exporter-values.yaml
[/simterm]
Check if the ServiceMonitor has been created:
[simterm]
$ kk -n monitoring get servicemonitor
NAME                                                          AGE
prometheus-blackbox-prometheus-blackbox-exporter-google.com   4m43s
[/simterm]
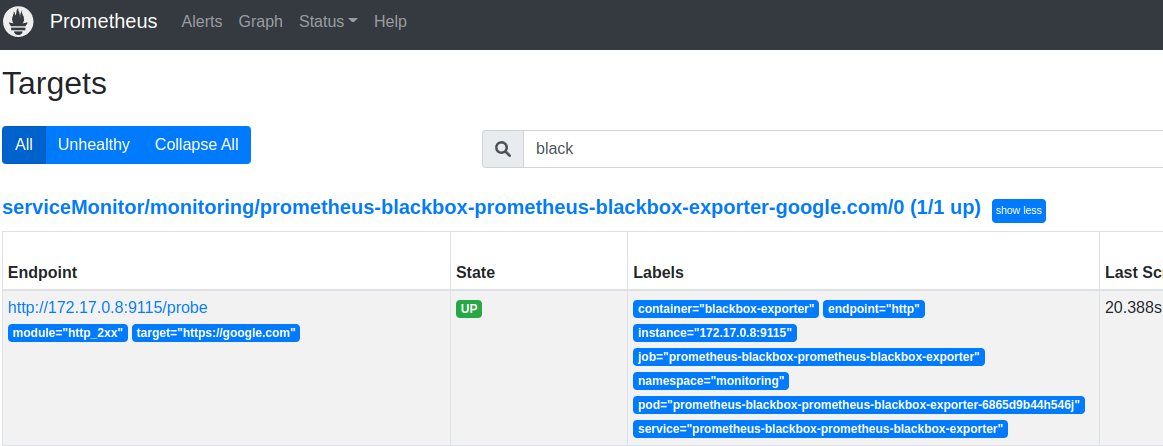
Check the Prometheus Targets:
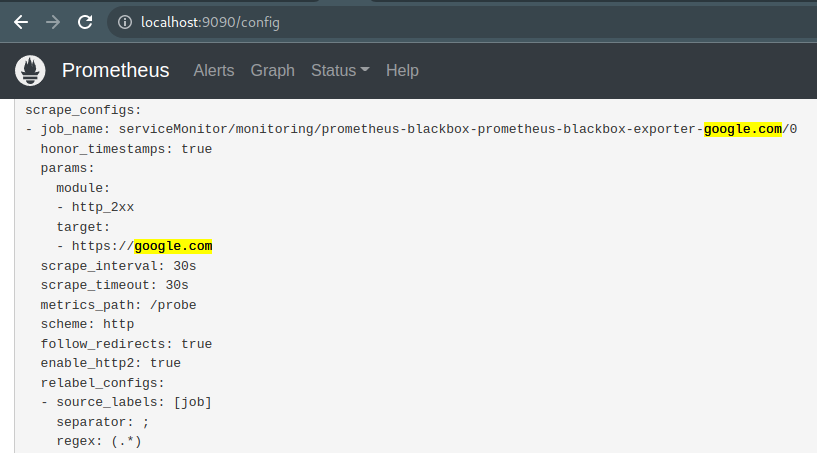
For each Target that we specify in the Blackbox configuration, a separate scrape job is added in the Prometheus:
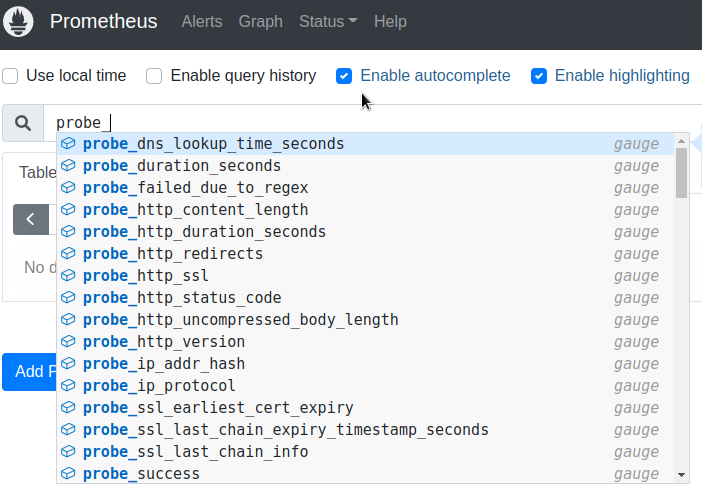
And check the Blackbox metrics:
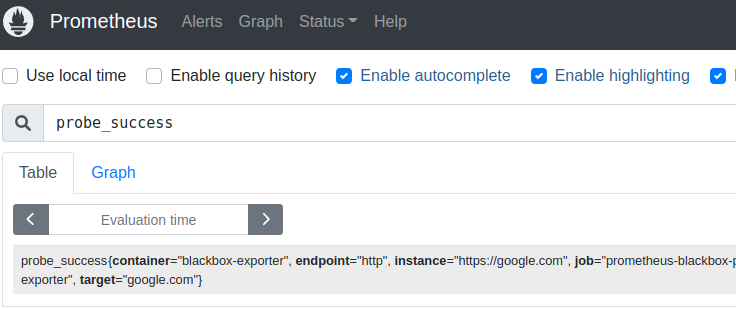
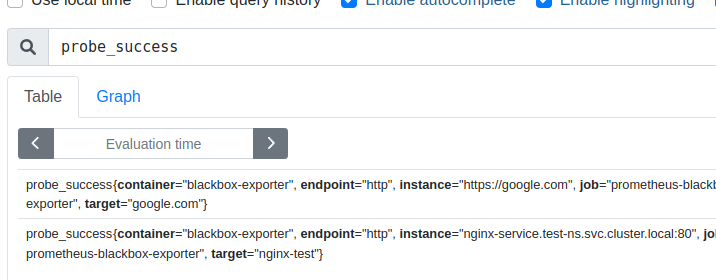
The main metric that I personally use is probe_success, which actually tells whether the check has been passed:
Here, in the target label, metricRelabelings sets a value from the name filed of the target from the Blackbox config, and the instance label has the URL.
Internal endpoints monitoring
Great – we went to Google, and it even works.
What about checking endpoints within a cluster?
Let’s take the example of nginx from the Kubernetes documentation, just will deploy its Pod and Service to our own namespace, not the default.
Create a namespace:
[simterm]
$ kk create ns test-ns
namespace/test-ns created
[/simterm]
Create a manifest with the Pod and Service, add your namespace:
apiVersion: v1
kind: Pod
metadata:
  name: nginx
  namespace: test-ns
  labels:
    app.kubernetes.io/name: proxy
spec:
  containers:
  - name: nginx
    image: nginx:stable
    ports:
      - containerPort: 80
        name: http-web-svc
---
apiVersion: v1
kind: Service
metadata:
  name: nginx-service
  namespace: test-ns
spec:
  selector:
    app.kubernetes.io/name: proxy
  ports:
  - name: name-of-service-port
    protocol: TCP
    port: 80
    targetPort: http-web-svc
Deploy it:
[simterm]
$ kk apply -f testpod-with-svc.yaml
pod/nginx created
service/nginx-service created
[/simterm]
Check the resources:
[simterm]
$ kk -n test-ns get all
NAME        READY   STATUS    RESTARTS   AGE
pod/nginx   1/1     Running   0          23s

NAME                    TYPE        CLUSTER-IP      EXTERNAL-IP   PORT(S)   AGE
service/nginx-service   ClusterIP   10.106.58.247   <none>        80/TCP    23s
[/simterm]
Update the Blackbox config:
serviceMonitor:
  enabled: true
  defaults:
    labels:
      release: prometheus
  targets:
    - name: google.com
      url: https://google.com
    - name: nginx-test
      url: nginx-service.test-ns.svc.cluster.local:80
Update the Helm release:
[simterm]
$ helm -n monitoring upgrade --install prometheus-blackbox prometheus-community/prometheus-blackbox-exporter -f blackbox-exporter-values.yaml
[/simterm]
Check ServiceMonitors again:
[simterm]
$ kk -n monitoring get servicemonitor
NAME                                                          AGE
prometheus-blackbox-prometheus-blackbox-exporter-google.com   12m
prometheus-blackbox-prometheus-blackbox-exporter-nginx-test   5s
[/simterm]
And in a minute we can check the probe_success:
In general, it is not necessary to specify the full URL in the form of nginx-service.test-ns.svc.cluster.local – it will be enough to set it like servicename.namespace, that is nginx-service.test-ns, but the full URL, in my opinion, looks more usable in labels and alerts.
Blackbox Exporter modules
Everything looks great until we poll a common HTTP endpoint that always returns a 200 code.
But how can we check for other HTTP codes?
Let’s create our own module using Blackbox probes:
config:
  modules:
    http_4xx:
      prober: http
      timeout: 5s
      http:
        method: GET
        valid_status_codes: [404, 405]
        valid_http_versions: ["HTTP/1.1", "HTTP/2.0"]
        follow_redirects: true
        preferred_ip_protocol: "ip4"
serviceMonitor:
  enabled: true
  defaults:
    labels:
      release: prometheus
  targets:
    - name: google.com
      url: https://google.com
    - name: nginx-test
      url: nginx-service.test-ns.svc.cluster.local:80
    - name: nginx-test-404
      url: nginx-service.test-ns.svc.cluster.local:80/404
      module: http_4xx
Here in the modules we specify the name of the new module – http_4xx, which probe it should use – the http, and the parameters for this probe – what kind of request to use, and which response codes we consider correct.
Next, in the Targets for nginx-test-404, we explicitly specify the use of the module http_4xx.
Modules testing
Let’s see how we can check whether the module will work as we expect.
Everything is simple: run a test pod, and use the curl with the -I option to check the response of the endpoint.
For a TCP connection, you can use the telnet.
So, create a Pod with Ubuntu, and connect to it by running the bash:
[simterm]
$ kk -n monitoring run pod --rm -i --tty --image ubuntu -- bash
[/simterm]
Install the curl and telnet:
[simterm]
root@pod:/# apt update && apt -y install curl telnet
[/simterm]
And check if the nginx-service.test-ns.svc.cluster.local:80/404 is working and which response code it will return:
[simterm]
root@pod:/# curl -I nginx-service.test-ns.svc.cluster.local:80/404
HTTP/1.1 404 Not Found
[/simterm]
404 – as we expected.
Update the Blackbox with a new configuration:
[simterm]
$ helm -n monitoring upgrade --install prometheus-blackbox prometheus-community/prometheus-blackbox-exporter -f blackbox-exporter-values.yaml
[/simterm]
Let’s check its ConfigMap – whether the module http_4xx that we specified in our config file has been added:
[simterm]
$ kk -n monitoring get cm prometheus-blackbox-prometheus-blackbox-exporter -o yaml
apiVersion: v1
data:
  blackbox.yaml: |
    modules:
      http_2xx:
        http:
          follow_redirects: true
          preferred_ip_protocol: ip4
          valid_http_versions:
          - HTTP/1.1
          - HTTP/2.0
        prober: http
        timeout: 5s
      http_4xx:
        http:
          follow_redirects: true
          method: GET
          preferred_ip_protocol: ip4
          valid_http_versions:
          - HTTP/1.1
          - HTTP/2.0
          valid_status_codes:
          - 404
          - 405
        prober: http
        timeout: 5s
[/simterm]
And check the result in the Prometheus:
probe_success{target="nginx-test-404"} == 1 – “It works!” (c)
TCP Connect and a database server monitoring
Another module that we use very often is the TCP, which simply tries to open a TCP connection to the specified URL and port. Suitable for checking databases and any other non-HTTP resources.
Let’s start a MySQL server:
[simterm]
$ helm repo add bitnami https://charts.bitnami.com/bitnami
$ helm install mysql bitnami/mysql
[/simterm]
Find its Service:
[simterm]
$ kk get svc
NAME             TYPE        CLUSTER-IP     EXTERNAL-IP   PORT(S)    AGE
kubernetes       ClusterIP   10.96.0.1      <none>        443/TCP    20h
mysql            ClusterIP   10.99.71.124   <none>        3306/TCP   40s
mysql-headless   ClusterIP   None           <none>        3306/TCP   40s
[/simterm]
Update the Blackbox config:
config:
  modules:
    ...
    tcp_connect:
      prober: tcp
serviceMonitor:
  ...
  targets:
    ...
    - name: mysql
      url: mysql.default.svc.cluster.local:3306
      module: tcp_connect
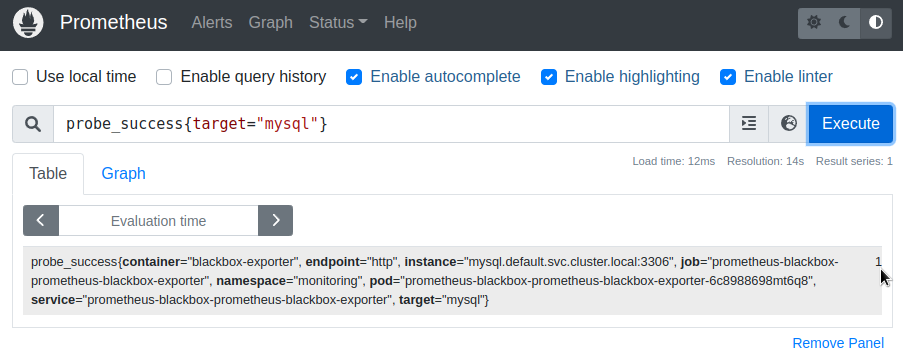
Deploy and check:
Prometheus alerting
There is nothing special to write about alerting – everything is standard like any other Prometheus alerts.
For example, we monitor Apache Druid Services with the following alert (screen from a Terraform configuration with some variables):
Just check that probe_success != 1.
Useful links
- Blackbox exporter probes – more probes examples

