
How to monitor and alert on Nginx ingress in Kubernetes
Learn how to set up monitoring and alerting for Nginx ingress in a Kubernetes environment.
In this blog post, we will discuss how to set up monitoring and alerting for Nginx ingress in a Kubernetes environment.
We will cover the installation and configuration of ingress-nginx, Prometheus, and Grafana, and the setup of alerts for key Ingress metrics.

Pre-requisites :
- A Kubernetes cluster
- Helm v3
Install Prometheus and Grafana
In this step, we will install Prometheus to collect metrics, and Grafana to visualize and create alerts based on those metrics.
Let’s install the kube-prometheus-stack helm chart by copying the below-mentioned commands to your terminal. This will set up Grafana, Prometheus, and other monitoring components.
# Add and update the prometheus-community helm repository.
helm repo add prometheus-community https://prometheus-community.github.io/helm-charts
helm repo update
cat <<EOF | helm install kube-prometheus-stack prometheus-community/kube-prometheus-stack \
--create-namespace -n monitoring -f -
grafana:
enabled: true
adminPassword: "admin"
persistence:
enabled: true
accessModes: ["ReadWriteOnce"]
size: 1Gi
ingress:
enabled: true
ingressClassName: nginx
hosts:
- grafana.localdev.me
EOFLet’s see if the installed components are up and running :
kubectl get pods -n monitoring

NAME                                                        READY   STATUS    RESTARTS        AGE
kube-prometheus-stack-grafana-7bb55544c9-qwkrg              3/3     Running   0               3m38s
prometheus-kube-prometheus-stack-prometheus-0               2/2     Running   0               3m14s
...
Looks great, let’s proceed to the next section.
Install & configure Ingress Nginx
In this step, we will install and configure Nginx ingress controller and enable metrics that can be scraped by Prometheus.
- Let’s install ingress-nginx into our cluster using the command below:
helm upgrade --install ingress-nginx ingress-nginx \
  --repo https://kubernetes.github.io/ingress-nginx \
  --namespace ingress-nginx --create-namespace \
  --set controller.metrics.enabled=true \
  --set controller.metrics.serviceMonitor.enabled=true \
  --set controller.metrics.serviceMonitor.additionalLabels.release="kube-prometheus-stack"
Here we’re specifying serviceMonitor.additionalLabels to be release: kube-prometheus-stack so that Prometheus can discover the service monitor and automatically scrape metrics from it.
- Once the chart is installed, let’s deploy a sample app podinfo into
defaultnamespace.
helm install --wait podinfo --namespace default \
oci://ghcr.io/stefanprodan/charts/podinfo- Now, create an ingress for the deployed podinfo deployment :
cat <<EOF | kubectl apply -f -
apiVersion: networking.k8s.io/v1
kind: Ingress
metadata:
  name: podinfo-ingress
spec:
  ingressClassName: nginx
  rules :
  - host: podinfo.localdev.me
  defaultBackend:
    service:
      name: podinfo
      port:
        number: 9898
EOF
Let’s understand a bit about the above ingress config :
- We’re using
ingress-nginxas our ingress controller, hence the ingress class is defined asnginx. - In the above config, I’ve used the host address for my Ingress as
podinfo.localdev.me. - The DNS
*.localdev.meresolves to127.0.0.1, hence for any local testing, this DNS can be used without the hassle of adding an entry into/etc/hostsfile. - Podinfo app serves HTTP API over port
9898, hence it’s specified for the backend port i.e. when the traffic arrives for the domainhttp://podinfo.localdev.me, it will be forwarded to9898of podinfo service.
4. Next, from your terminal, port-forward the ingress-nginx service so that you can send traffic from your local terminal.
kubectl port-forward -n ingress-nginx service/ingress-nginx-controller 8080:80 > /dev/null &- Port
80on the host is a privileged port, so we’re not using that. Instead, we’re binding port80of nginx service to8080of host machine. You can specify any valid port of your choice.
Note: If you’re running this in any cloud, port-forwarding is not required as LoadBalancer for ingress-nginx service will be auto-created since the service type is defined as LoadBalancer by default.
5. Now, you can run the below curl request to the podinfo endpoint, which should respond with :
> curl http://podinfo.localdev.me:8080
"hostname": "podinfo-59cd496d88-8dcsx"
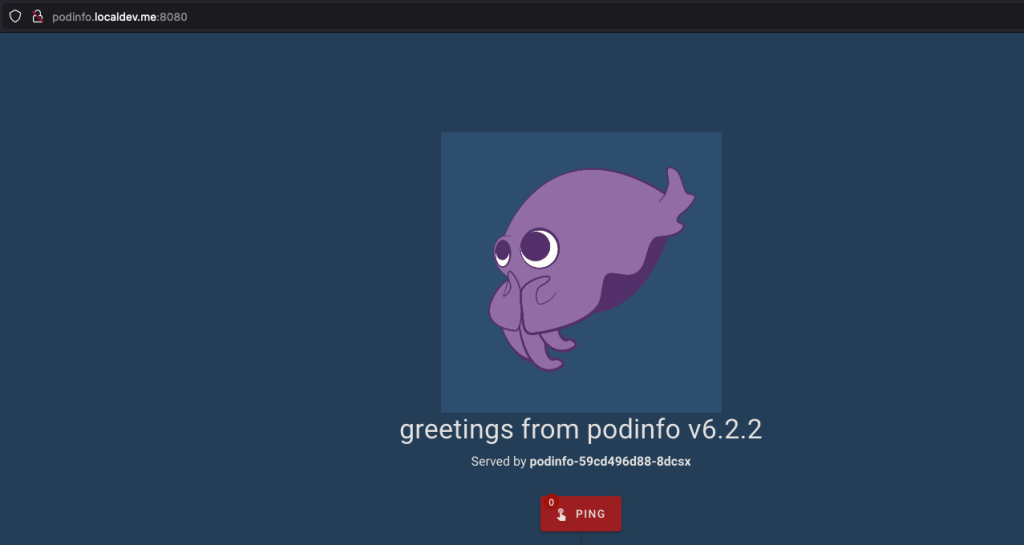
"message": "greetings from podinfo v6.2.2"6. You can also get the prettier look in the browser with URL : http://podinfo.localdev.me:8080/
Configure Grafana Dashboards for Ingress Nginx monitoring
To access Grafana, you can open the below URL in your browser with the credential admin:admin : http://grafana.localdev.me:8080/.
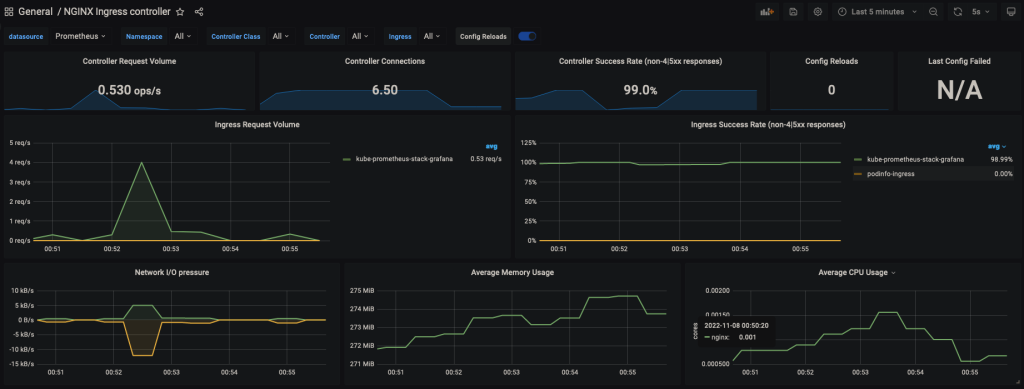
Copy thenginx.json from here and paste it into http://grafana.localdev.me:8080/dashboard/import to import the dashboard.
Once imported, the dashboard should look like this :
Generate sample loads
In order to get traffic on our my podinfo application, we’ll be using vegeta as a load testing tool. Please install it from here.
Let’s generate a sample HTTP 4xx traffic. To do that, you can run the below command which will run at a request rate of 10 RPS for 10 minutes.
echo "GET http://podinfo.localdev.me:8080/status/400" | vegeta attack -duration=10m -rate=10/s- You can just change the status code from 400 to 500 and run as well for test 5xx throughput.
For latency tests, I’ve used the below command as GET /delay/{seconds} waits for the specified period :
echo "GET http://podinfo.localdev.me:8080/delay/3" | vegeta attack -duration=10m -rate=100/sNote: You can read more on the endpoints available in podinfo app from here.
Alerting over SLI metrics with Grafana
The newer Grafana comes with its own alerting engine. That helps in keeping all config, rules, and even firing alerts in one place. Let’s configure alerts for common SLI.
4XX Error Rate
- Let’s create an alert by going to http://grafana.localdev.me:8080/alerting/new
- We can use the following formula to get 4xx error rate percentage :
(total number of 4xx requests / total number of requests) * 100
- Add the below expression for the query :
(sum(rate(nginx_ingress_controller_requests{status=~'4..'}[1m])) by (ingress) / sum(rate(nginx_ingress_controller_requests[1m])) by (ingress)) * 100 > 5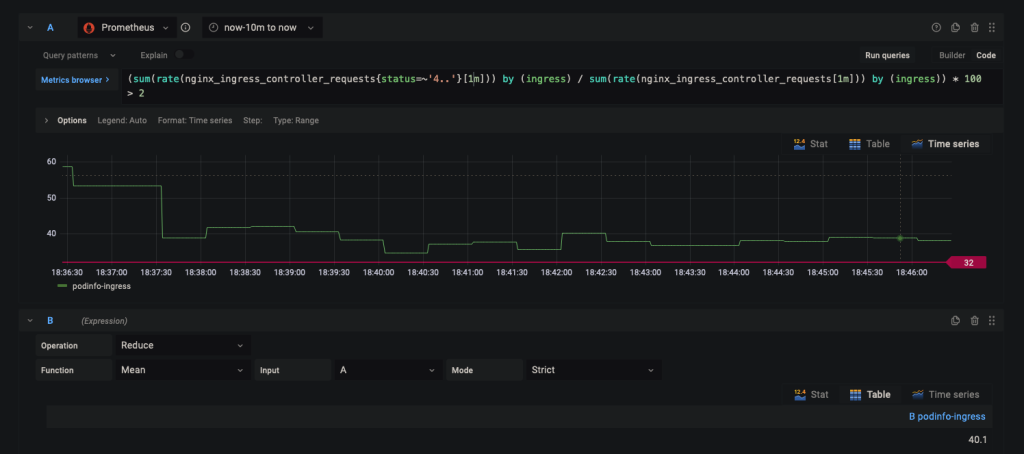
- In Expression
B, useReduceoperation with the functionMeanfor inputA.
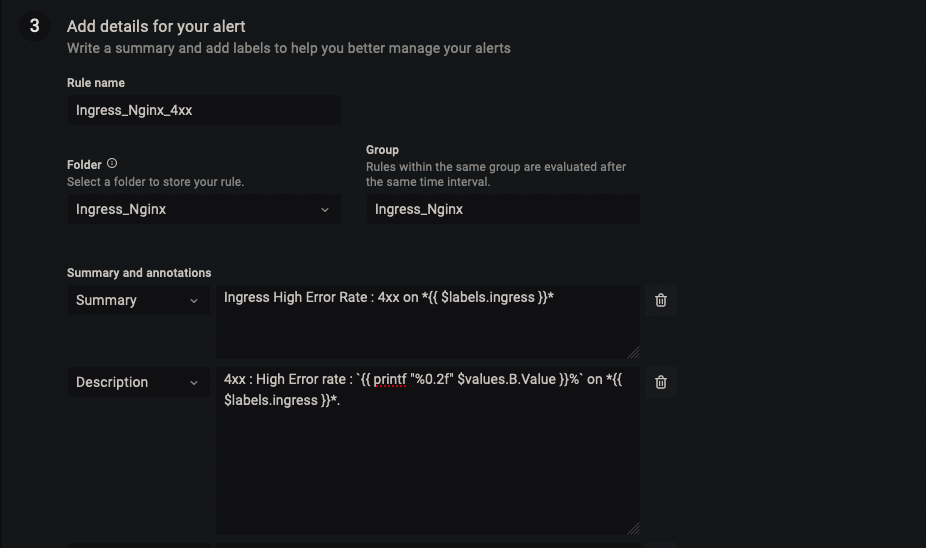
- In Alert Details, Name the alert as per your liking, I’ve named it
Ingress_Nginx_4xx. - For Summary, we can keep it as short as possible, by just displaying the Ingress name with label
{{ $labels.ingress }}.
Ingress High Error Rate : 4xx on *{{ $labels.ingress }}*- For Description, I’ve used
printf "%0.2f"to display up to two decimals on the percentage value.
4xx : High Error rate : `{{ printf "%0.2f" $values.B.Value }}%` on *{{ $labels.ingress }}*.- Overall alert should look similar to the below snapshot :
- In the end, you can add a custom label like
severity : critical.
5XX Error Rate
Similar to 4xx alert config, 5xx error rate can also be queried with the below query :
sum(rate(nginx_ingress_controller_requests{status=~'5..'}[1m])) by (ingress,cluster) / sum(rate(nginx_ingress_controller_requests[1m]))by (ingress) * 100 > 5Note: I’ve configured the alert to be triggered then the 5xx/4xx percentage is > 5%. You can set it as per your error budget.
High Latency (p95)
To calculate the 95th percentile of request durations over the last 15m we can use the nginx_ingress_controller_request_duration_seconds_bucket metric.
It gives you The request processing time in milliseconds and since its a bucket we can use histogram_quantile function.
Create an alert similar to the above examples and use the below query :
histogram_quantile(0.95,sum(rate(nginx_ingress_controller_request_duration_seconds_bucket[15m])) by (le,ingress)) > 1.5I’ve set the threshold to 1.5 seconds, it can be updated as per your SLO.
High request rate
To get the request rate per second (RPS), we can use the below query :
sum(rate(nginx_ingress_controller_requests[5m])) by (ingress) > 2000The above query will trigger an alert when the request rate is greater than 2000 RPS.
Other SLIs to consider
Connection rate: This measures the number of active connections to Nginx ingress, and can be used to identify potential issues with connection handling.
rate(nginx_ingress_controller_nginx_process_connections{ingress="ingress-name"}[5m])Upstream response time: The time it takes for the underlying service to respond to a request, this will help to identify issues with the service and not just the ingress.
histogram_quantile(0.95,sum(rate(nginx_ingress_controller_response_duration_seconds_bucket[15m])) by (le,ingress)) Slack Alert Template
To make alert messages meaningful, we can use alert templates in Grafana.
- In order to configure them, go to http://grafana.localdev.me:8080/alerting/notifications and create a new template named
slackby pasting the below code block :
{{ define "alert_severity_prefix_emoji" -}}
    {{- if ne .Status "firing" -}}
        :white_check_mark:
    {{- else if eq .CommonLabels.severity "critical" -}}
        :fire:
    {{- else if eq .CommonLabels.severity "warning" -}}
        :warning:
    {{- end -}}
{{- end -}}

{{ define "slack.title" -}}
    {{ template "alert_severity_prefix_emoji" . }}  {{- .Status | toUpper -}}{{- if eq .Status "firing" }} x {{ .Alerts.Firing | len -}}{{- end }}  |  {{ .CommonLabels.alertname -}}
{{- end -}}

{{- define "slack.text" -}}
{{- range .Alerts -}}
{{ if gt (len .Annotations) 0 }}
*Summary*: {{ .Annotations.summary}}
*Description*: {{ .Annotations.description }}
Labels:
{{ range .Labels.SortedPairs }}{{ if or (eq .Name "ingress") (eq .Name "cluster") }}• {{ .Name }}: `{{ .Value }}`
{{ end }}{{ end }}
{{ end }}
{{ end }}
{{ end }}- Configure a new contact point of type Slack. For this, you need to create an incoming webhook from Slack. Refer this doc for more detailed steps.
- Edit the contact point slack and scroll down and select the option
Optional Slack settings. - In the Title, enter the below to specify the template to use:
{{ template "slack.title" . }}- In the Text Body, enter the below and save it :
{{ template "slack.text" . }}- Go to http://grafana.localdev.me:8080/alerting/routes and configure the Default contact point to be Slack.
Finally, the alert message arrives!
After configuring all the steps, finally we arrive at the end, and below are the snapshots of how the alert will look on your slack.
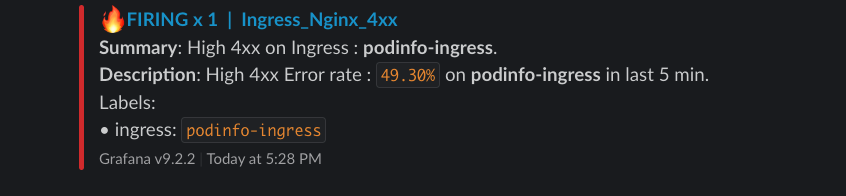
4xx Error Rate :
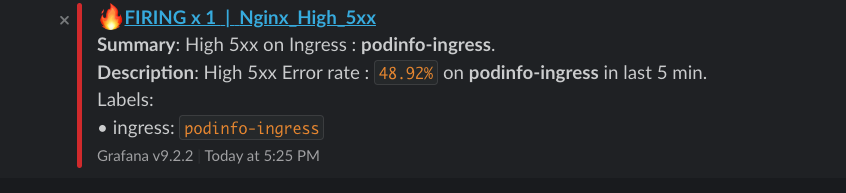
5xx Error Rate :
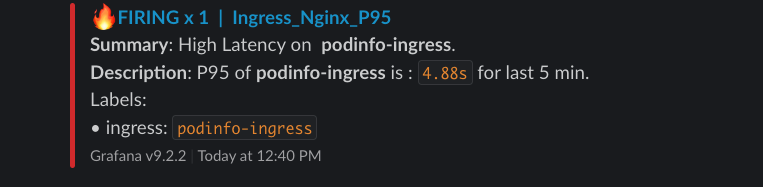
Latency P95 :
There are lots of things one can improve according to their requirements. For example, if you have multiple Kubernetes clusters, you can add a cluster label that will help in identifying the source cluster for the alert.
References
https://grafana.com/docs/grafana/latest/alerting/
https://kubernetes.github.io/ingress-nginx/user-guide/monitoring/
Aviator: Automate your cumbersome merge processes
Aviator automates tedious developer workflows by managing git Pull Requests (PRs) and continuous integration test (CI) runs to help your team avoid broken builds, streamline cumbersome merge processes, manage cross-PR dependencies, and handle flaky tests while maintaining their security compliance.
There are 4 key components to Aviator:
- MergeQueue – an automated queue that manages the merging workflow for your GitHub repository to help protect important branches from broken builds. The Aviator bot uses GitHub Labels to identify Pull Requests (PRs) that are ready to be merged, validates CI checks, processes semantic conflicts, and merges the PRs automatically.
- ChangeSets – workflows to synchronize validating and merging multiple PRs within the same repository or multiple repositories. Useful when your team often sees groups of related PRs that need to be merged together, or otherwise treated as a single broader unit of change.
- FlakyBot – a tool to automatically detect, take action on, and process results from flaky tests in your CI infrastructure.
- Stacked PRs CLI – a command line tool that helps developers manage cross-PR dependencies. This tool also automates syncing and merging of stacked PRs. Useful when your team wants to promote a culture of smaller, incremental PRs instead of large changes, or when your workflows involve keeping multiple, dependent PRs in sync.