
How do you visualise dependencies in your Kubernetes YAML files?
May 2019

Welcome to Bite-sized Kubernetes learning — a regular column on the most interesting questions that we see online and during our workshops answered by a Kubernetes expert.
Today's answers are curated by Daniele Polencic. Daniele is an instructor and software engineer at Learnk8s.
If you wish to have your question featured on the next episode, please get in touch via email or you can tweet us at @learnk8s.
Did you miss the previous episodes? You can find them here.
How do you visualise dependencies in your Kubernetes YAML files?
TL;DR: There isn't any static tool that analyses YAML files. But you can visualise your dependencies in the cluster with Weave Scope, KubeView or tracing the traffic with Istio.
When you have a large number of resources in your cluster, you might lose track of all relationships between them.
Keeping track of dependencies is even more challenging when you're managing distributed teams or have several clusters.
Would not be nice if you could have a tool that reads a repository and show the dependencies between your Deployments, Services, Persistent Volume Claims, etc.?
Unfortunately, such a tool doesn't exist for YAML.
YAML is a human-readable configuration language, and it doesn't have a way to express relationships with other YAML files.
You could write a tool to analyse YAML files and link them together statically, but you will have to code all the rules that power Kubernetes such as namespaces, selectors, etc. to make sure that you can draw a correct dependency graph.
Even with such a tool, you wouldn't be able to describe that a front-end component is consuming a backend API.
The relationship isn't expressed in the YAML but in the application.
However, if your goal is to visualise dependencies, you could focus on the cluster and ignore the YAML.
Option #1 — Weave Scope, the Kubernetes dashboard
Weave Scope is one of those tools that — once installed into your cluster — can help you visualise your Kubernetes resources in a dependency graph.
Weave scope connects to the Kubernetes API and queries your resources to draw a dependency graph.
As an example, have a look at the dependencies for the microservices-demo project from Google Cloud Platform — a collection of ten microservices that are meant to be demoing an e-commerce website.
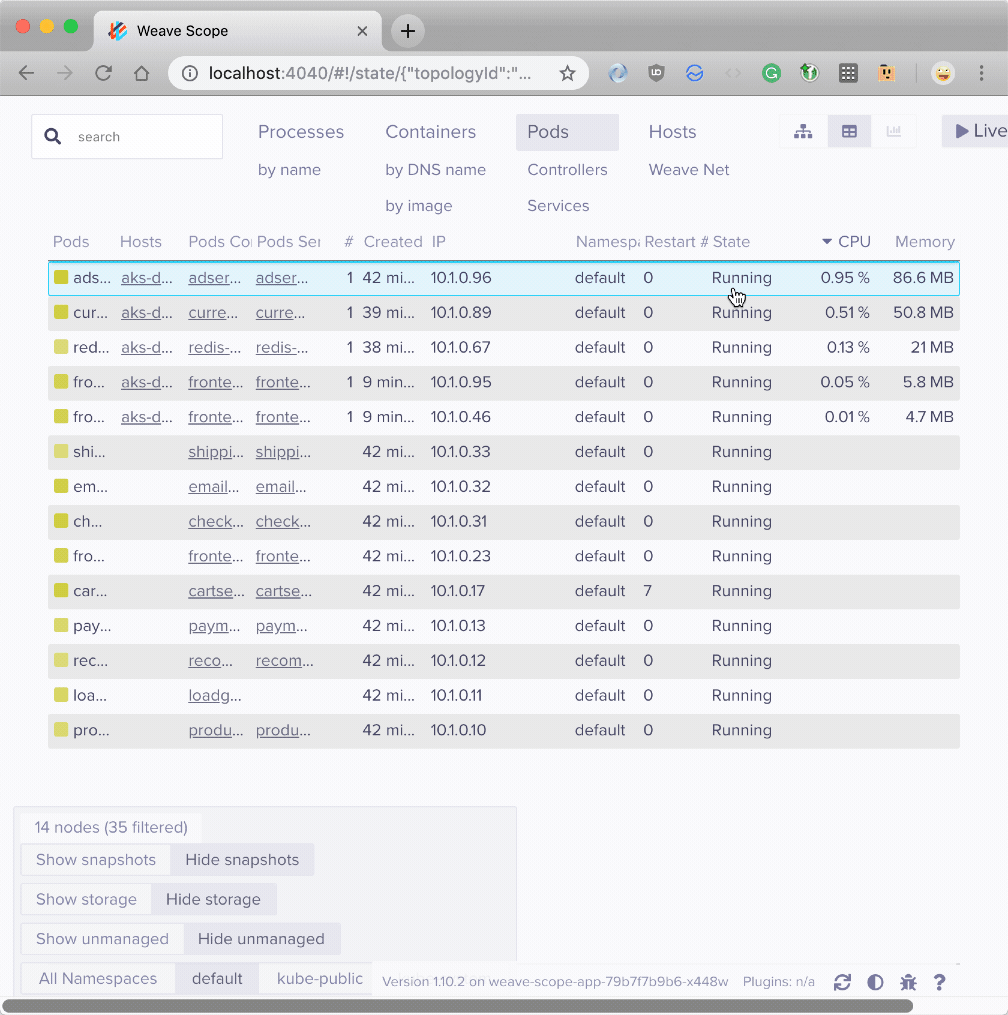
As you can see the tool automatically maps dependencies between Pods.
The tool isn't limited to dependencies, though.
As part of the installation process, you can have agents on every node that probe the nodes for metrics.
You can use Weave Scope to monitor for CPU and memory in your nodes as well as other useful metrics.
And even better, Weave Scope has a mechanism to create custom plugins.
Weavescope isn't the only tool that can identify and visualise dependencies in your cluster.
Option #2 — A view on Kubernetes resources
In many aspects, KubeView is similar to WeaveScope.
It is deployed as a pod in your cluster and consumes the Kubernetes API in real-time.
And, as Weavescope, it can analyse dependencies between resources and present them as a concise graph.

Kubeview is a less ambitious project and doesn't include plugins or a mechanism to surface metrics such as CPU usage or memory consumption.
However, the project is small in scope, and it's easy to hack on the code and extended with other features.
It's also an excellent example to learn how you could write your controller to interact with the Kubernetes API using Javascript.
The entire logic that queries and retrieves resources from the API is self-contained in a single file.
Option #3 — Tracing the traffic
If you could trace all the traffic between your components, you should be able to visualise the dependency and observe the state of your system in real time.
Even if you don't use Kubernetes.
A tool such as Istio or Linkerd2 is designed to do just that: augment your network so you can debug, observe, and secure your traffic without requiring any changes to your code.
In this example, you will have a look at Istio, but the same applies to any other similar technology.
After you install Istio in your cluster, every new Pod has a companion container that is in charge of routing all the inbound and outbound traffic to that Pod.
You can think about it as a proxy container.
The proxy does a lot more than just routing the traffic, though.
It can collect metrics and receive instructions from the control plane.
When every app in your cluster has a sidecar proxy, you can visualise the flow of the traffic.
Here's the same collection of microservices deployed in a cluster with Istio enabled:

As you can see the graph is identical to the one drawn by Weave Scope.
Note that Istio didn't have to interrogate the Kubernetes API to draw any of it.
Using a service mesh such as Istio, isn't a free lunch, though.
Adding it to an existing cluster is not trivial, because you have to recreate all the Pods with the proxy container.
And having an extra container attached to every Pod affects latency and resource consumption.
More options
Three noteworthy tools can help visualise dependencies in your cluster:
- Linkerd2, another service mesh similar to Istio
- Kubebricks, an electron app that connects to your cluster using kubectl and helps you visualise your dependencies
- Jaeger is a distributing tracing system. You could use Jaeger to trace the request in your network and visualise the traffic as well as the dependencies.
That's all folks
Have you built a tool to visualise your cluster?
Or have a recommendation to visualise dependencies?
Let us know in an email or tweet us @learnk8s.
A special thank you goes to Cesar Tron-Lozai that reviewed the content of this article.
Don't miss the next article!
Be the first to be notified when a new article or Kubernetes experiment is published.
*We'll never share your email address, and you can opt-out at any time.